
Boutique en ligne
Réservations
Événements
Éphémère

Pie Chart PRO
Par
Easily Add a Pie Chart on your Site
3.0
7 jours d'essai gratuit


Aperçu de Pie Chart PRO
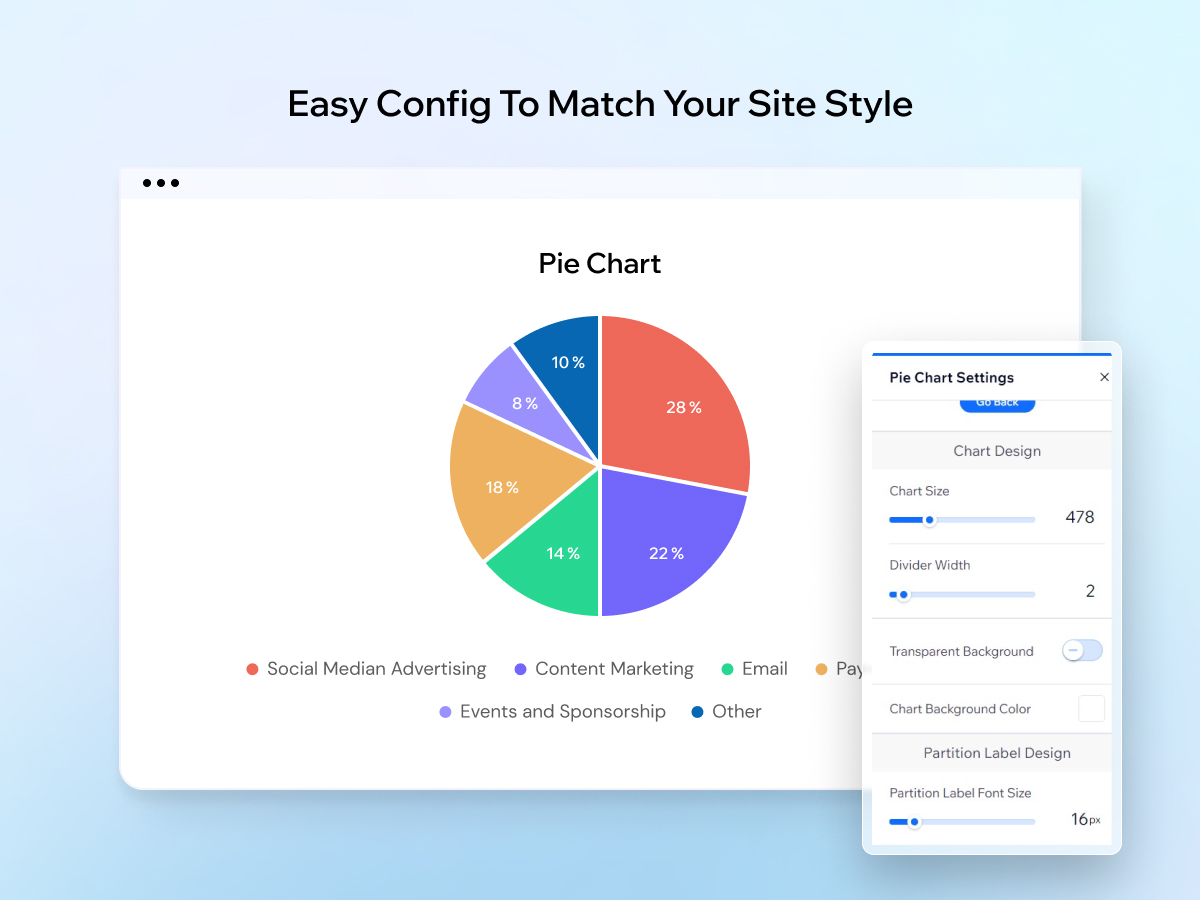
- Effortless Configuration and Customization: Quickly create a visually appealing pie chart with our intuitive setup. Easily define partition data, set labels that appear on hover, and adjust chart size to fit your site's design. Personalize your chart with optional images in partitions, ensuring it aligns perfectly with your site's aesthetic
- Dynamic Legend and Hover Labels: Improve data comprehension with a dynamic legend displayed below the chart and partition labels that appear on mouse hover. These features help visitors understand your data effortlessly, making the pie chart a valuable tool for presenting complex information in a digestible format
- Responsive Design for Mobile and Desktop: Ensure a seamless user experience across devices by configuring different views for mobile and desktop. The pie chart's size and appearance are easily adjustable, offering a fully responsive solution that maintains clarity and functionality regardless of screen size
- Advanced Data Integration and Velo Support: Unlock the full potential of your pie chart by connecting it to an API or using Velo to set the data programmatically. This advanced feature allows developers to dynamically update chart data, making the widget perfect for displaying real-time analytics, market trends, or user-generated content
Catégories
Disponibilité :
Cette application est disponible dans le monde entier.Langues de l'application :
Anglais
M
Appli développée parMarketPushApps
Visiter notre siteContacter l'AssistancePolitique de confidentialité
Market Push Apps SRL s'assure qu'il respecte la législation commerciale de l'UE.
Note moyenne 3.0
2 avis
5
1
4
0
3
0
2
0
1
1
Trier par :
KE
Kernywhyte/ Sep 6, 2025
Amazing The pie chart helps a lot especially when it comes to business analysis and more I'd recommend it for any designer looking fore a pro website
(0)
Merci pour votre avis
YO
Youarenirvana03/ Aug 29, 2025
Don't Work!!!!!page keep crashing. no useful for custom make graphs . bought full version. I need my money back!!!!
MA
équipe de MarketPushApps
Hello!
Can you please send us an email at support@marketpushapps.com with what exactly is not working, and what you are trying to achieve? We are more than happy to help.
Thank you!(0)
Merci pour votre avis
Prix et formules
Cette appli propose un essai gratuit de 7 joursFormule Premium
$
1
49
/mois
Add a Pie Chart On Your Site
Easily Set Partition Size & Color
Advanced Chart Legend & Design
Optional: Set Data Using Velo Or API
* Le prix est en USD.